

Understanding Trading Bots: A Practical Guide
Explore trading bots in Pakistan's markets🤖. Learn how they work, benefits, risks, strategies, and tips for smarter automated trading.
Edited By
Amelia Clarke
Trading signals play a key role in making smart choices in the fast-moving world of stocks, forex, and commodities trading. But what exactly are these signals? How do they work, and why do traders in Pakistan and around the globe rely on them? This guide aims to clear the fog around trading signals by explaining their types, sources, and how to use them wisely.
Whether you’re a seasoned trader or just starting out, understanding trading signals can give you that edge to recognize buying or selling opportunities before the crowd does. But be warned, signals aren’t foolproof—they come with risks and require careful analysis.
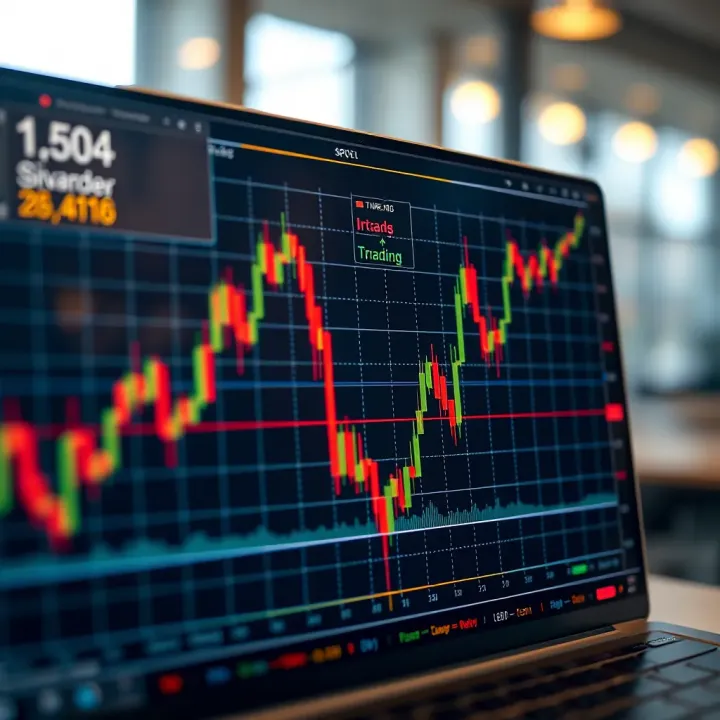
In this article, you'll find practical insights on how trading signals fit into your overall strategy. We’ll cover:
What trading signals actually are and their purpose
Different categories of signals—from technical indicators to copy trading
How traders analyze these signals to make decisions
Common sources providing signals, including Pakistan-specific platforms
The risks and limitations to keep in mind when following signals
By the end, you should have a clearer picture of how and when to trust trading signals, helping you avoid common pitfalls and boost your trading game with confidence and caution.
Understanding the nuances of trading signals is like tuning your antenna in a noisy neighborhood—knowing when to listen and when to ignore makes all the difference.
Trading signals stand at the core of decision-making for many traders, acting like a guiding beacon through the often unpredictable financial markets. At its base, a trading signal suggests the right moment to buy or sell a financial asset—be it stocks, forex, or commodities—helping traders pinpoint profitable opportunities or avoid potential losses. Without them, many would simply be flying blind, struggling to make sense of price movements or market news.
Imagine a trader in Karachi alert to a sudden boost in the rupee against the dollar based on certain economic reports or chart patterns. That trader's choice to enter or exit the market often hinges on these trading signals. Given the busy and fast-moving financial environment in Pakistan and worldwide, these signals streamline analysis, save time, and can spare traders costly mistakes.
Trading signals are alerts or cues generated by analysis methods designed to inform traders about probable moments to execute trades. They can originate from technical analysis tools like moving averages or RSI, fundamental news such as changes in interest rates, or sentiment indicators reflecting market mood. The purpose is straightforward: to cut through the noise and help traders make informed decisions rather than acting on guesswork or impulsive moves.
For example, when the 50-day moving average crosses above the 200-day moving average—a classic "golden cross" signal—it often heralds an upward price trend. Traders, recognizing this, might decide to buy the asset expecting profits. Similarly, earnings reports indicating strong revenue growth can serve as fundamental signals prompting investors to enter positions.
Trading signals save time and reduce emotional strain by providing clear entry or exit points. Especially for those juggling multiple markets or assets, these signals serve as a trusted second opinion or confirmation that complements their own analysis.
Furthermore, signals help manage risk. By following alerts based on tested strategies, traders can avoid rash decisions and instead rely on a process shaped by data. This is critical in volatile environments such as Pakistan's stock market, where geopolitical events or policy shifts can lead to sudden price swings.
Let's say a trader uses a signal provider that highlights overbought conditions in a particular stock via oscillators like MACD or RSI. Knowing when the asset might be topping out enables the trader to lock in gains or prepare for a reversal. This doesn't guarantee success, but it lowers the chances of being caught on the wrong side of a trade.
Key takeaway: Trading signals serve as practical tools that help turn complex market information into actionable insights. They empower traders to make decisions based on analysis rather than guesswork, which is especially valuable in today's fast-paced and often unpredictable markets.
Understanding the different types of trading signals is a key step for any trader wanting to make smarter decisions. These signals act like signposts, guiding traders through the market chaos. Knowing which signals to watch for — and how to interpret them — can dramatically improve your chances of spotting profitable trades while avoiding costly mistakes. In Pakistan’s dynamic market environment, this knowledge becomes even more useful.
Technical signals rely on historical price data and trading volume to predict future market moves. They are popular among traders due to their clear-cut rules and ease of application.
Technical indicators and chart patterns form the backbone of many trading systems. Indicators such as Bollinger Bands or Fibonacci retracements highlight moments when prices might reverse or trend more strongly. Chart patterns like head and shoulders, double tops, or flags signal potential turning points or continuation of trends. For example, spotting a classic "cup and handle" pattern in a Pakistan Stock Exchange share might indicate a bullish move just around the corner.
These tools provide actionable insight by visualizing supply and demand, momentum shifts, and market psychology. They’re practical because they’re grounded in quantifiable price behavior rather than speculation.
Moving averages smooth out price fluctuations to show overall direction. Simple Moving Averages (SMA) or Exponential Moving Averages (EMA) are widely used to spot trends early. For instance, when the 50-day SMA crosses above the 200-day SMA, it signals a potential uptrend called a "golden cross." This approach is straightforward and helps traders avoid jumping into trades based on noisy price spikes.
Using moving averages in Pakistani forex trading, like watching EUR/PKR pairs, can give traders a better sense of where the market is heading without getting lost in day-to-day wiggles.
Relative Strength Index (RSI) and Moving Average Convergence Divergence (MACD) are oscillators that measure momentum and can signal overbought or oversold conditions. RSI values above 70 often suggest the asset is overbought, while values below 30 might indicate oversold.
Similarly, MACD shows momentum through the interaction of moving averages. A MACD line crossing above the signal line often points to bullish momentum. These signals help traders decide when to enter or exit, especially when prices are stuck in tight ranges.
Fundamental signals come from economic and financial data, helping traders understand the bigger picture beyond chart patterns.
Releases like GDP growth rates, inflation figures, and interest rate announcements have a direct impact on currency values and stock prices. Traders watching Pakistan’s inflation trends or State Bank of Pakistan’s monetary policy decisions use this data to anticipate market direction.
For example, if Pakistan’s inflation unexpectedly rises, the PKR might weaken, giving forex traders a signal to adjust their positions accordingly. Staying updated with scheduled reports from institutions like the Pakistan Bureau of Statistics is a must.
Stocks often react strongly to quarterly earnings results. Better-than-expected earnings can cause a sharp rise in share price, while disappointing earnings usually trigger declines.
In Pakistan’s stock market, companies like Oil & Gas Development Company Limited or Lucky Cement regularly release earnings that influence market sentiment. Traders who keep an eye on these reports can spot buying opportunities before prices react fully.
Sentiment signals reveal how traders and investors feel about the market, which can sometimes lead price moves.
Tools like the Volatility Index (VIX) or put-call ratios gauge fear or optimism among traders. A sudden spike in volatility or an unusually high ratio of put options may hint that traders expect a market downturn.
Although less common in local markets, sentiment indicators are gaining ground among Pakistani traders using global platforms. They provide a broader view that complements technical and fundamental analysis.
In today’s connected world, news headlines or viral social media posts can sway markets within minutes. For example, rumors about changes in Pakistan’s economic policies or major corporate announcements often trigger quick moves in related stocks or currencies.
Trading platforms like Bloomberg or Reuters, as well as Twitter feeds from credible market analysts, are invaluable for catching these fast-moving signals. However, it’s important to verify facts, as fake news can lead to false signals and costly trades.
Understanding these different types of trading signals empowers traders not just to react but to anticipate market moves. Combining technical, fundamental, and sentiment signals can offer a more rounded, reliable approach to trading in Pakistan’s markets.
Understanding how trading signals come to life is quite important if you want to use them wisely. It’s not just about blindly following alerts; it’s about knowing what’s behind the curtain—how these signals are crafted. This helps traders, whether beginners or pros, to gauge the reliability and relevance of the signals in their own trading strategies.
Trading signals can be produced in two main ways: by manual analysis or through automated systems. Each method has its unique pros and cons, and often traders use a blend of both to get well-rounded insights. Let’s break down both approaches to see what makes them tick.
Manual analysis relies on the eyes and instincts of experienced traders or financial experts who study markets, charts, news, and economic data to generate trading signals. Think of this as the old-school way of trading where people actively look at patterns, trends, and market sentiment to figure out the right entry or exit points.
For example, an expert following the stock market in Pakistan might notice a recurring pattern where the Pakistan Stock Exchange’s (PSX) top stocks tend to rally after announcements of improved GDP figures. Using this observation, they might recommend buying certain stocks anticipating a price uptrend. This kind of signal emerges from 'reading the room'—understanding not only numbers but also political developments, regulatory changes, and local market behavior that automated systems may miss.
Manual analysis is particularly handy when markets behave unpredictably or during major geopolitical events when technical indicators alone can give false signals. However, it does require time and significant expertise. Plus, human bias can sneak in, leading to mistakes if the trader isn’t cautious.
On the flip side, automated systems use pre-set rules coded into software to scan vast amounts of data and generate signals quickly and efficiently. These systems rely on formulas, technical indicators like RSI, MACD, moving averages, or even machine learning to predict market moves.
Take MetaTrader 5, for instance—this popular platform lets traders set up expert advisors (EAs), which execute trades or suggest signals based on algorithmic strategies. These EAs can process thousands of data points in seconds, spotting opportunities that would take a human ages to catch.
Automated signals bring consistency and speed, especially beneficial in fast-moving markets like forex or cryptocurrency. They eliminate emotional bias, sticking strictly to the programmed strategy. However, they’re only as good as their design; bad coding or outdated algorithms might generate poor signals. Market shocks or unexpected news events can throw off automated models because they lack the contextual awareness a human analyst might have.
In essence, the way trading signals are generated shapes their effectiveness. Manual analysis offers context and experience, while automated systems provide speed and scale. Smart traders often combine both to balance intuition with technology.
Whether you lean on a seasoned expert’s insight or an algorithm’s rapid-fire data crunching, understanding the backbone of signal generation sets you up for smarter decisions in Pakistan’s dynamic markets.
When diving into the world of trading, having the right tools to receive trading signals isn't just a luxury, it's a necessity. These tools help cut through the noise of the markets and deliver timely information to make smarter decisions. Understanding the landscape of these platforms is vital for anyone serious about trading, especially in markets like Pakistan where access to accurate and localised data can sometimes be patchy.
The primary benefit of these platforms is convenience. They automate or streamline the delivery of complex trade ideas and market insights, which can save traders a lot of time and effort. Moreover, by using established platforms, traders gain access to a community or network of experts and peers, which can be invaluable for getting different perspectives.
Subscription-based services have gained popularity because they offer curated trading signals directly to subscribers, often for a monthly fee. These providers use a mix of technical analysis, fundamental research, or sentiment tracking to generate signals. For example, a well-known provider like Trading Central offers signals tailored to specific markets including forex and stocks, helping traders catch potential entry and exit points.
However, it’s wise to choose providers with a proven track record and transparent performance statistics. Blindly trusting signals from an unknown source can lead to costly mistakes. In the Pakistani context, some local brokers and financial service firms may offer subscription-based signals tailored for active stocks listed on the Pakistan Stock Exchange (PSX), which can be more relevant than generic international signals.
Several trading platforms come with built-in signal features that alert users based on preset technical criteria. MetaTrader 4 and MetaTrader 5 remain staples in forex trading, offering users indicators like Moving Averages, RSI, and MACD embedded within the software. These platforms can generate alerts automatically when specific trading conditions are met.
Using software with built-in signals reduces reliance on external providers and gives traders more control to customize their alerts according to their own strategy. For instance, traders using MetaTrader can tweak the RSI levels to suit a volatile currency pair like USD/PKR. This customization makes the signals more aligned with one’s trading style.
Social trading has transformed how many traders access signals. Platforms like eToro or ZuluTrade allow users to see, follow, and copy trades from experienced traders in real time. This 'learn-by-doing' approach suits beginner or intermediate traders who want practical insights beyond just raw signals.
Social networks combine both analytic signals and community wisdom. Following a seasoned trader who has a disciplined strategy on these platforms can help users understand when and why to act, all while testing the waters without huge upfront expertise. Particularly in Pakistan, where formal financial education circulars might be limited, social trading offers a window into global trading practices.
Choosing the right platform depends on your trading goals, level of expertise, and how much control you want over the signals. Always remember to test any new platform with a demo account before putting real money on the line.
By understanding the strengths and drawbacks of these popular tools, traders can better navigate the signal landscape and improve their chances of success in the markets.
In trading, relying on signals without checking their reliability can lead to costly mistakes. It's important to evaluate trading signals carefully before taking action. Reliable signals help traders in Pakistan and elsewhere make informed decisions rather than gambling blindly. Assessing how trustworthy a signal is involves looking at several factors, including a signal provider's track record, transparency, and whether the signals meet consistent and realistic criteria. Let's break down each aspect to understand their significance.
The first thing to check is a signal provider’s past performance. A solid track record offers clues about how effective their signals have been over time. For example, if a signal service claims impressive returns but only has a few months of data, it’s wise to approach with caution. Real-world trading is influenced by many market conditions, so performance consistency across different periods matters more than short-term spikes.
Imagine a forex signal provider who advertises 90% success but only posts profit reports for a single bullish trend period. When the market turns choppy, their signals might flop. Traders should ask for verified records showing trades, outcomes, and risk levels. Services like Myfxbook or Verified Trading Journal can help vet historical results. This way, you avoid falling for providers who cherry-pick their best trades or hide losses.
Transparency is about how openly a signal provider shares information about their methods, fees, and results. If details are vague or cloaked in marketing buzzwords, that’s a red flag. Good providers disclose how their signals are generated—be it through technical indicators, machine algorithms, or expert analysis. They also clarify their fee structure so traders know what they’re paying for.
Take a Pakistani stock market signals vendor who sends daily recommendations but won’t explain how those picks are chosen. Without transparency, it’s hard to judge signal quality or trust the advice. On the other hand, a transparent provider might explain their reliance on earnings reports and macroeconomic trends, and even offer trial periods or refunds if signals don’t meet agreed standards. Such openness builds confidence.
Transparency also means admitting limitations. No one can predict markets perfectly, so any claims of "guaranteed" wins are usually suspect.
A reliable signal should be consistent and grounded in practical reality. That means delivering signals regularly without wild swings from one approach to another. It should follow a logical trading strategy rather than random guesses.
For instance, if a cryptocurrency signal channel suddenly shifts from supporting long-term trend trading to day-trading scalps without explanation, it’s hard to trust their expertise. Consistent signals demonstrate a tested method with defined entry and exit points.
Realism ties into how achievable the signals’ targets are. If a provider promises doubling your investment every week, that’s unrealistic—markets don’t work like that. Instead, good signals set moderate, achievable goals and warn when markets are too volatile for strong predictions.
Evaluating whether signals align with known market behaviors, like how oil prices react to geopolitical events or how import duties affect textile stocks in Pakistan, helps ground decision-making in real conditions.
Evaluating trading signals isn't about finding a magic bullet; it's about carefully picking tools that fit your trading style and goals. By checking a provider’s track record, demanding transparency, and weighing consistency and realism, you reduce risks and boost your chances of trading success.
Trading signals are tools, not crystal balls, and using them wisely can mean the difference between steady profits and needless losses. In practice, signals offer hints based on market data, but it's up to you how they fit into your own approach and risk tolerance. Let's break down how to absorb and apply these signals smartly, especially for traders in Pakistan navigating somewhat volatile markets.
To make trading signals work for you, first blend them into your existing strategy rather than blindly following every alert. For example, if you're a swing trader focusing on mid-term moves in the Karachi Stock Exchange, you might use moving average crossover signals as a trigger to look closer but confirm with other technical indicators like RSI or volume changes.
Think of signals as signposts, not destinations. They should prompt actionable analysis rather than automatic trades. You might set a rule: only take trades if two or more signals align, reducing the chance of chasing false alarms. This method builds a solid foundation instead of shaky guesses.
Even the best signals can lead you astray, so managing risk when acting on them is key. Always define your stop-loss levels ahead of time based on how much capital you’re willing to risk per trade. For instance, if a forex signal suggests entering a USD/PKR trade, decide beforehand that you’ll exit if the price drops more than 1.5%—don’t wait for emotions to decide.
Diversification matters, too. Avoid putting all your eggs in one basket just because a signal looks promising. Spread your trades across different assets or sectors. In the Pakistani stock market context, mixing signals for tech stocks with some signals from energy stocks can shield you from sector-specific downturns.
Relying solely on signals can make you complacent or blindsided. Markets aren’t static; signals generated from past data might not always reflect unexpected global events or sudden market sentiment shifts.
To stay ahead, keep improving your own analysis skills and never treat signals as a replacement for judgment. For example, if a sudden political development affects Pakistan’s economy, a previously solid technical buy signal might lose meaning fast. Combine signals with a keen eye on news, economic calendars, and overall market mood.
Remember, trading signals are a tool to sharpen your decision-making, not a magic wand. Balancing them with personal insight and solid risk practices keeps you on track toward consistent results.
By integrating signals thoughtfully, managing risk prudently, and keeping your own judgment in the driver's seat, you can harness the benefits of trading signals with less risk of costly mistakes.
Trading signals can be valuable tools, but they come with their own set of risks that every trader should be aware of. Ignoring these pitfalls can lead to losses or misguided trades, especially in volatile markets like Pakistan’s stock and forex arenas. Understanding these drawbacks helps you use signals more wisely and avoid costly mistakes.
Not all trading signals are reliable. Sometimes, signals might suggest a bullish trend when the market is actually heading downwards, or vice versa. These false signals often happen due to technical glitches or poor data interpretation. For instance, a moving average crossover might indicate a buy, but sudden news events can quickly reverse the trend, making the signal misleading.
Traders relying solely on signals without cross-checking other indicators or news might get caught off guard. Imagine setting a buy order on Pakistan’s KSE100 index based on a faulty signal, only to watch prices slip because of an unexpected political event. Such scenarios underline the importance of validating signals before acting on them.
In the quest for easy profits, many fall prey to scam signal providers promising guaranteed returns. Unfortunately, the trading signal market is peppered with these untrustworthy players. They may sell outdated signals, use fake performance records, or provide generic tips that don’t suit your trading style or market.
An example is buying signals from unverified WhatsApp groups or social media channels claiming insider information without any proof. These scams can drain your investment quickly if you don’t do proper due diligence. Always check if the signal service provider is transparent about their track record and offers clear terms, especially those recognized by financial authorities or with strong reviews.
Market volatility is like a double-edged sword for trading signals. On one hand, it can create profitable trading opportunities; on the other, it can distort signals and increase their noise. In volatile periods—say during economic announcements or unexpected geopolitical developments—signals that worked under stable conditions might fail.
For example, a typical RSI (Relative Strength Index) signal indicating oversold conditions may not hold true during wild swings, causing premature buy orders that lead to losses. Traders need to understand how volatility affects the tools generating their signals and adjust their strategies accordingly.
Always pair trading signals with your market understanding and stay alert to external factors influencing price action. Blindly trusting signals without context, especially during turbulent times, can backfire badly.
Combining multiple signal types (technical, fundamental, sentiment) for confirmation
Regularly reviewing the credibility of signal sources
Applying strict risk management to guard against false signals
Monitoring market conditions and adapting signal interpretation
Keeping these factors in mind will help traders make better decisions, especially in fast-moving and sometimes unpredictable markets like those in Pakistan.
Trading signals don't wear a one-size-fits-all hat. They need tailoring to fit the market you trade in because every asset class rides on unique factors like volatility, market hours, and liquidity. Ignoring this can lead to false expectations and lower success rates. For example, what works well in stocks may flop in forex due to the differing market dynamics and driving forces.
Customizing signals allows traders to match tools and strategies to specific conditions, helping to squeeze out better entries and exits. It’s like using the right fishing bait in the right pond — the results improve when the approach suits the environment. Let's break it down further by market.
Forex markets move nearly 24/5, responding heavily to geopolitical events, central bank policies, and economic releases from varying countries. Custom signals here often focus on liquid currency pairs like EUR/USD or GBP/JPY, taking advantage of patterns in volatility spikes during news events or market openings.
A practical example is using signals based on the Average True Range (ATR) to gauge the daily volatility of a currency pair. When ATR rises sharply, it signals potential breakouts — a cue forex traders can act on. Also, many forex signals incorporate economic calendars to time trades around key releases like the US Non-Farm Payrolls.
Stocks generally react to company fundamentals, earnings reports, and market sentiment driven by broader economic trends. Signals tuned for stocks often emphasize volume analysis, moving averages like the 50-day and 200-day lines, and candlestick formations signaling reversals or breakouts.
Take the example of the MACD crossover for stocks such as Pakistan Stock Exchange’s influential blue chips like Engro or HBL. Such signals highlight momentum shifts that help traders decide whether to enter or exit positions. Plus, stock signals have to accommodate market hours strictly since the stock market is closed on weekends and public holidays, unlike forex.
Crypto markets don't sleep either, trading 24/7 and notorious for wild price swings influenced by factors like regulatory news, technology updates, or social media. Signals customized for crypto might lean heavily on sentiment analysis from platforms like Twitter or Reddit, plus technical indicators suited for high volatility like Bollinger Bands.
For instance, a signal might trigger a buy when Bitcoin’s RSI (Relative Strength Index) hits oversold territory during a market dip but also factors in sudden surges in social chatter to avoid catching a falling knife. Customized risk management approaches are crucial here because of crypto’s unpredictability.
In summary, customizing trading signals according to the market context isn’t just nice to have — it’s necessary. Each market's unique rhythms and influences demand specific tools and strategies. Tailoring your signals improves your chances of catching winning trades and avoiding costly errors, no matter if you're trading forex pairs, stocks, or the rapidly shifting world of cryptocurrencies.
When diving into trading signals, paying attention to the legal backdrop in Pakistan is more than just good practice—it’s a necessity. Trading signal services often operate in the gray areas between advice and brokerage, making it essential for traders to understand what’s allowed and what’s not. A clear grasp of regulatory frameworks helps protect your investments and keeps you out of hot water with the authorities, especially given the fast-evolving nature of the financial markets in Pakistan.
Pakistan's financial markets are overseen by the Securities and Exchange Commission of Pakistan (SECP), which lays down rules for financial services and trading platforms. Trading signal providers must operate under specific guidelines that ensure transparency and fairness. For example, the SECP has put in place regulations to monitor the conduct of brokerage firms and advisory services.
It’s important for traders to recognize that while there isn’t a one-size-fits-all regulation explicitly for trading signals, these services fall under broader securities advisory categories. This means providers should not give misleading information or guarantee profits, which would violate existing rules.
For instance, a signal service claiming a 100% success rate on Forex trades would likely be subject to scrutiny. Staying informed about updates from SECP notifications and circulars helps traders spot legitimate services from those operating on shaky ground.
When selecting a trading signal provider, it’s wise to verify their licensing status. Licensed providers have met certain standards, like proving their competence and following business ethics outlined by SECP. This reduces risk by ensuring the signals you follow are based on reliable analysis and not just empty promises.
Here are a few points to consider:
Check for SECP registration: Confirm that the provider is officially registered and authorized to offer advisory or brokerage services.
Review transparency: Licensed providers usually disclose their performance history and methodology openly.
Customer feedback and complaints: Paying attention to user reviews and any regulatory complaints filed against the provider can offer insight into their reliability.
To give a concrete example, MCB-Arif Habib Savings & Investments Limited operates under SECP’s regulations, providing advisory and trading research while maintaining compliance. Following providers like this can offer peace of mind.
Choosing compliant providers isn’t just about legality—it’s about protecting your hard-earned money from scams and faulty advice.
Building your own trading signals means creating personalized cues or triggers based on your specific trading criteria and analysis. It’s a way to cut through the noise and make decisions that align with your style and goals, rather than relying blindly on third-party signals. In Pakistan’s trading environment, where market dynamics can be quite different from global markets, tailoring your own signals allows for better adaptability and control.
This approach can bring several benefits: first, it boosts understanding of the markets since you’ll dig deeper into charts and data to define what matters to you. Second, it reduces guesswork by sticking to rules you trust. And finally, it helps manage risk because you’re not just following someone else’s strategy that might not suit your risk tolerance.
At the core of building your own trading signals is chart reading. Charts show the historical price action of an asset, which helps you spot patterns or trends. Understanding candlestick charts, for example, can be hugely helpful. Each candle shows open, high, low, and close prices for specific periods making it easier to visualize market moves.
Key concepts include support and resistance levels—areas where price tends to pause or reverse. Identifying these can guide entry and exit points. Also, recognizing chart patterns like head and shoulders or triangles can signal potential trend changes or continuations.
One practical tip is to start with daily charts for a broader view, then zoom into 1-hour or 15-minute charts when deciding exact trade timing. This multi-timeframe analysis can give better clarity.
Indicators assist in quantifying price action and spotting conditions not easily seen just by chart patterns. Some widely used ones include:
Moving Averages (MA): Simple or exponential MAs smooth out price data to show trend direction. For example, a 50-day MA crossing above the 200-day MA may suggest bullish momentum.
Relative Strength Index (RSI): Measures the speed and change of price movements. Readings above 70 suggest asset might be overbought; below 30 indicate oversold condition.
MACD (Moving Average Convergence Divergence): Combines moving averages to identify trend shifts and momentum.
When starting out, focus on a couple indicators that complement each other. Don't overwhelm your charts with too many signals; simplicity often signals more reliable setups.
Backtesting involves applying your trading rules or signals to historical market data to see how they would have performed. This step is essential before risking real money. For instance, if you create a signal based on RSI crossing below 30 on the 4-hour chart, you test this rule on past price movements of the Pakistan Stock Exchange (PSX) to check its success rate and drawdowns.
Many modern trading platforms, like MetaTrader 4 or TradingView, offer backtesting features that let you simulate trades easily. A consistent positive outcome doesn’t guarantee future success, but it does add confidence.
Every trader has different goals and risk appetite. Signals must be tweaked accordingly. For example, day traders might prefer signals that react quickly to short-term market moves, using indicators like the 5-minute RSI or volume spikes. Swing traders, on the other hand, could rely on daily charts and longer moving averages to catch bigger trends.
Customization also means adjusting your signal parameters — changing indicator periods, adding filters, or combining conditions — to fit what feels right personally. Over time, your observations and experiences should guide these tweaks.
Building your own signals is less about finding a “one-size-fits-all” system and more about crafting something that fits your approach like a glove. Start simple, test extensively, and refine steadily to improve both confidence and results.
Examining real-world examples where trading signals have led to profitable outcomes offers valuable lessons for traders and investors. Case studies help bridge the gap between theory and practice, showing how signals can be applied to actual market conditions and different trading environments. By understanding these examples, traders can grasp practical benefits such as timing entries and exits better, managing risk more effectively, and validating signal reliability.
Moreover, case studies highlight common pitfalls and how experienced traders adjust or discard signals when conditions change. This insight is especially important in markets like Pakistan, where volatility can be unpredictable and external factors like political events impact price movements.
In the forex market, trading signals based on technical indicators like the Moving Average Convergence Divergence (MACD) combined with economic calendar events have proven effective. For example, a trader following the USD/PKR pair noticed consistent signals from a crossover in MACD coinciding with major US Federal Reserve announcements. When the MACD line crossed above the signal line just before an interest rate hike, this often led to a strong upward move in USD/PKR.
By backtesting this strategy over several months, the trader found a success rate around 65%, which is decent given forex market volatility. The key takeaway was not to rely only on the MACD but also to include fundamental events to validate the signal. This approach helped reduce false positives that purely technical setups can produce.
In the Pakistani stock market, traders often look at volume spikes combined with price action as a signal for potential breakouts. A case study involving the stock of Pakistan Oilfields Limited (POL) showed that when the stock experienced unusually high volume accompanied by a breakout above its 20-day moving average, it often signaled a sustained rally.
One trader used this signal consistently throughout 2023, entering positions shortly after such volume-price confirmations. This strategy worked well during the market recovery phase post-pandemic when liquidity returned. However, the trader also noted that during highly volatile periods, such signals could lead to quick reversals, emphasizing the need for strict stop losses.
Tip: Case studies emphasize the importance of combining trading signals with sound money management and constant market observation. No signal guarantees profits, but careful use can tilt the odds in your favor.
Both examples show that successful trading signal use depends heavily on context, blending technical and fundamental factors, and personal risk tolerance. For traders in Pakistan and elsewhere, these stories underline that learning from experience—your own or others'—is one of the most valuable ways to build effective trading strategies.
Explore trading bots in Pakistan's markets🤖. Learn how they work, benefits, risks, strategies, and tips for smarter automated trading.
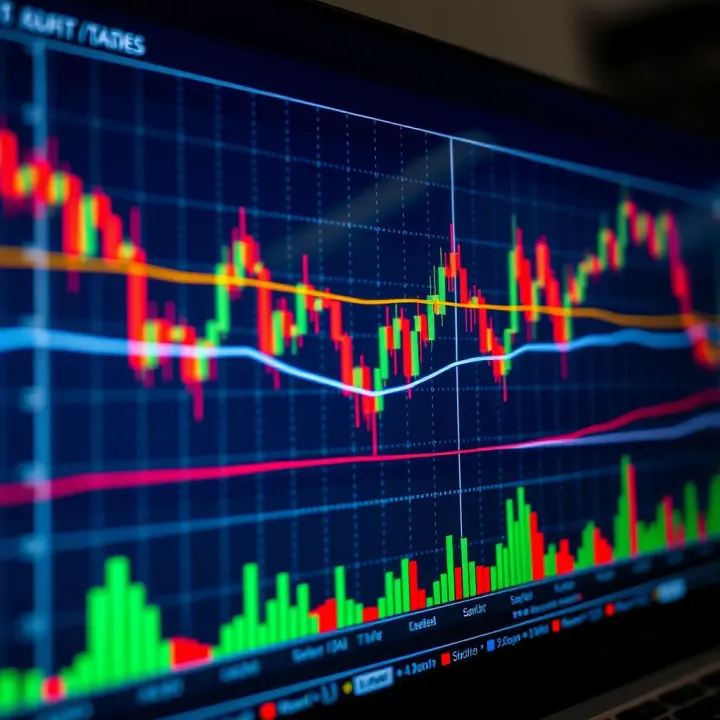
📈 Master trading patterns with this practical guide! Learn key chart types, strategies, and where to find reliable PDF resources to boost your Pakistan trading skills.
📈Explore essential trading insights for individuals & businesses in Pakistan. Learn strategies, types & risk management to trade smarter locally & globally.
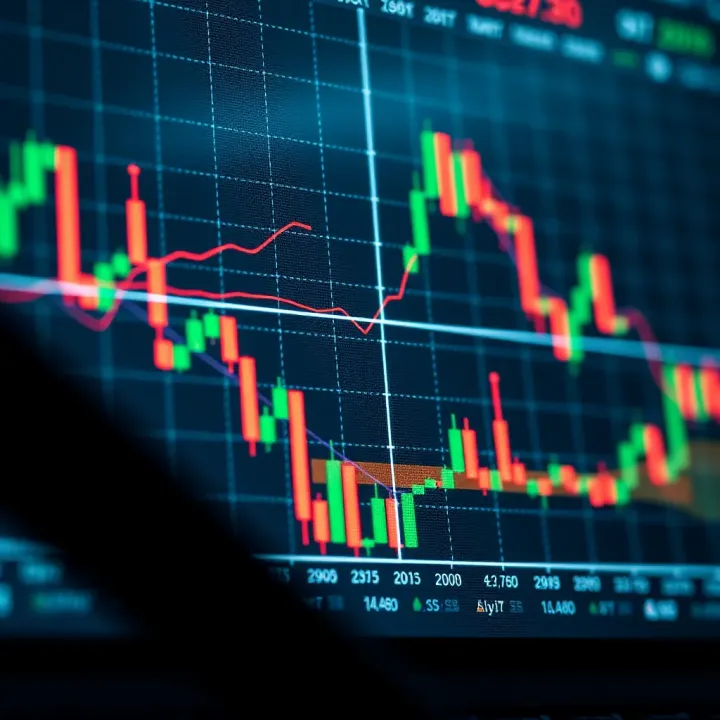
📊 Master trading charts with our detailed guide for traders in Pakistan. Learn to read charts, use technical indicators, spot patterns, and avoid common pitfalls! 🚀
Based on 13 reviews