
How to Use TradingView with Deriv
📈 Learn how to seamlessly integrate TradingView charts and tools with Deriv, overcoming challenges and boosting your trading strategies effectively.
Edited By
Amelia Clarke
TradingView has become a trusty companion for many traders across Pakistan and elsewhere, offering powerful charting tools that bring market data to life. But it’s more than just pretty lines and colorful graphs. Using these charts well can make a huge difference in how you see market movements, predict trends, and ultimately decide when to buy or sell.
Before diving into the nitty-gritty details, this article aims to demystify how TradingView charts work and how they can be tailored to your style of trading or analysis. Think of it as a toolbox — knowing when and how to pick the right tool saves time and prevents headaches.
You’ll get hands-on advice on setting up charts, interpreting candlesticks and other data types, and using built-in indicators wisely. We'll also cover customizing your view to reduce clutter or highlight what really matters to you, and ways to share your insights with others.
This guide is particularly relevant for traders and analysts who want to sharpen their decision-making skills using TradingView — whether day trading in Karachi or analyzing long-term trends in Lahore.
Good chart analysis isn’t about seeing the future perfectly. It’s about reading the clues the market gives and stacking the odds in your favor.
Let’s get started with clear steps to make TradingView charts work for you—not the other way around.
Starting off with TradingView charts can feel like stepping into a bustling market for the first time. The amount of data and options available might seem overwhelming, but getting a solid grip here pays off in faster, better trading decisions. This section lays the foundation, showing you how to set up your charts correctly and understand the basics before jumping deeper into analysis.
Choosing the right settings from the get-go tailors your charts to your trading style and objectives. For instance, a day trader looking to catch quick moves won’t find hour-long charts as useful as 5- or 15-minute ones. Similarly, picking the right market and asset means you’re focusing your tool where it matters most, whether it’s the Karachi Stock Exchange or the Nasdaq.
Also, as you’ll see, understanding different chart types helps you interpret price actions in ways that align best with your approach. All these basics combined make your trading workflow smoother and more efficient, reducing noise and highlighting relevant market signals.
Before looking at any numbers, first choose the market you want to trade in. If you’re interested in Pakistani equities, selecting the Pakistan Stock Exchange (PSX) is essential. For those dabbling in forex, perhaps USD/PKR or EUR/USD pairs should be in focus. The choice of asset directly influences your potential trading strategies and the kind of data you’ll monitor.
Selecting the asset helps narrow your study and keeps you from drowning in irrelevant information. For example, focusing on Energy sector stocks like Oil & Gas Development Company Limited (OGDC) allows you to learn sector-specific trends, which are different from tech stocks.
Picking a timeframe on TradingView determines how price movements get plotted and analyzed. A short timeframe, say 1-minute or 5-minute charts, suits scalpers and day traders who want to catch tiny price moves within the day. On the other hand, swing traders and investors might prefer daily, weekly, or even monthly charts to spot longer-term trends.
The trick is to align the timeframe with your trading objective. For example, if you trade PSX stocks based on daily news and events, a daily chart showing price changes over weeks or months can help you spot meaningful patterns instead of getting lost in intraday noise.
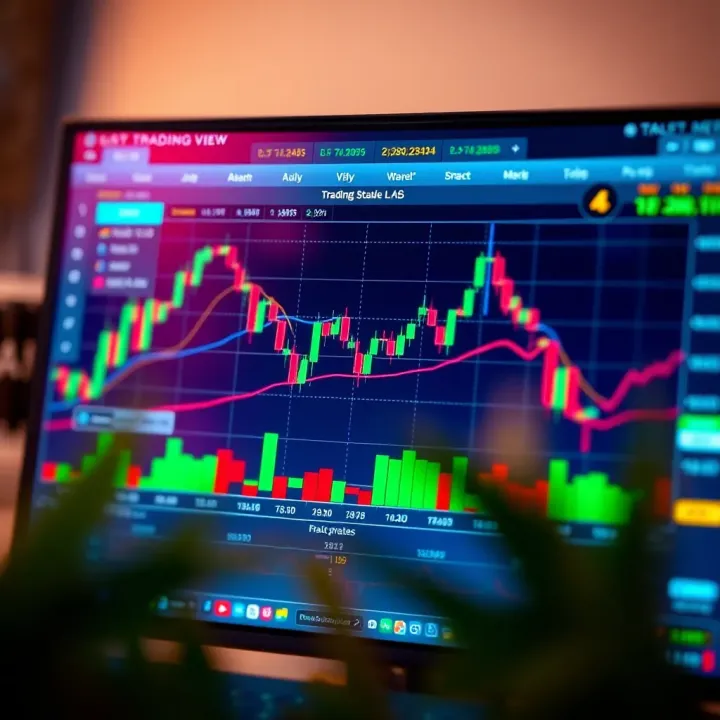
When you open your first TradingView chart, you’ll see several elements: the price plot, time axis at the bottom, price scale vertically on the right, and often volume bars beneath the price area. Taking a quick tour of these parts helps you make sense of what’s in front.
For instance, the price scale on the right shows you whether a stock price is moving up or down clearly, while the time axis helps match price moves to specific dates or hours. Volume bars indicate how much trading is happening, which can confirm if a price move is backed by strong participation or not.
Getting comfortable with where everything sits sets you up for effortless navigation and helps avoid second-guessing during live trading.
Line charts draw a simple line connecting closing prices across chosen intervals. They’re straightforward and give a clean look at overall trend direction. However, they don’t show fluctuations within that interval, like wicks or intra-period highs and lows.
Use line charts if you want a quick glance at where price is heading without fuss. For example, a long-term investor tracking the overall growth of HBL won’t need minute-by-minute candle details — a line chart suffices.
Bar charts offer a bit more detail with vertical lines representing the range between high and low prices during the period, and horizontal ticks showing open and close. This gives a fuller picture of price action than line charts without overcrowding.
Bar charts are handy if you want to spot how prices moved within an interval and compare opening and closing levels quickly. Traders who want to see volatility and session strength like to work with bar charts.
Candlestick charts are probably the most popular style. Each candlestick shows open, high, low, and close in a clear, color-coded format — usually green for upward moves and red for downward.
This visual cue makes spotting market moods easier. For instance, a long red candle on PSX index might indicate strong selling pressure. Patterns formed by candles, like hammers or engulfing patterns, can hint at potential reversals.
Candlestick charts blend detail with clarity, giving traders actionable insights.
Heikin Ashi charts smooth out price action by averaging data points, which helps filter out market noise. These charts don't show exact prices but provide a clearer trend by reducing the number of false signals.
Traders who hate jumping the gun on moves use Heikin Ashi to stick with genuine trends longer. For example, while a candlestick chart might show quick reversals in OSAMA stock, Heikin Ashi could keep the focus on the sustained direction, helping avoid frequent trades.
Remember, the chart type you pick shapes how you perceive the market. Don't hesitate to switch between types to fit your strategy or to get different perspectives on the same data.
Interpreting the data that appears on your TradingView charts is like reading a map before you set off on a journey — it helps you see where you are, and where you might be headed. For traders and investors, especially those navigating Pakistan's markets, interpreting price and volume data accurately can make the difference between a smart trade and a costly mistake. This section dives into the essentials: how price action and volume work together and how to spot key support and resistance levels that influence price behavior.
Reading price movements is the foundation of trading. Price action tells the story of how buyers and sellers interact over time. When watching a candlestick chart on TradingView, each candle reveals information: the open, high, low, and close within the selected timeframe. For example, in the Pakistan Stock Exchange, spotting a series of green candles closing higher might suggest buying pressure building up on a stock like Engro Fertilizers, signaling a potential upward move.
Traders should look beyond just the color of the candles. Notice if the wicks are long, especially on the top or bottom, indicating rejection of prices at certain levels. If a candle closes near its high with a small lower wick, it's a sign buyers are dominating that period. Over multiple bars, this could point to a trend forming. Recognizing such patterns on TradingView allows you to anticipate likely moves rather than just reacting.
Using volume to confirm trends is a practical step many often overlook. Volume shows how many shares or contracts have changed hands, and a move without volume is like a car without fuel — it doesn’t go far. For instance, if you see an uptrend in the price of a Pakistan index like KSE-100, but volume is steadily dropping, that trend could be losing steam and might reverse soon.
On TradingView, volume is usually displayed in bars below the price chart. When volume spikes coincide with price movement — say a breakout above resistance — it adds credibility to the move. Conversely, if volume is low during a breakout, it could be a false signal. By paying attention to volume alongside price, traders gain an extra layer of confirmation before entering or exiting trades.
Horizontal support and resistance are like invisible walls where price tends to bounce or stall. Identifying these levels on TradingView charts gives traders a way to predict where price might hesitate or reverse. Take the example of Pakistani bank stocks, which often find support near established price points over days or weeks. Drawing horizontal lines on TradingView at these levels highlights areas where demand or supply has historically changed the price direction.
The practical benefit here is in placing stop-loss or take-profit orders smartly. If a stock repeatedly struggles to move above a certain price (resistance), placing a sell order just below that line can help lock in gains. Similarly, buying close to a strong support level reduces the risk of big losses if the price bounces back.
Trendlines and channels take this concept a notch higher. Rather than just horizontal lines, trendlines connect a series of swing highs or lows, showing the overall direction of the market. When prices respect these lines on TradingView — bouncing off an upward trendline or falling from a downward one — it signals that the trend is intact.
Channels go a step further by adding parallel lines to frame the price action within upper and lower boundaries. For example, if a Pakistani energy stock moves within a rising channel, buying near the channel's lower boundary and selling near the upper can be an effective strategy. These tools help you visualize and anticipate where price might head next, offering tactical points to enter or exit trades.
Properly interpreting the price action, volume, and support/resistance levels on TradingView charts equips traders with a clearer roadmap, reducing guesswork and improving decision-making in volatile markets like Pakistan's.
By mastering these basics, you set yourself up for better timing and smarter trades. Remember, charts don't guarantee success, but understanding what they tell you gives you a leg up in the competitive trading arena.
Built-in technical indicators on TradingView are like tools in a trader’s toolbox—they help simplify complex price movements and assist in making quicker, smarter decisions. These indicators pull from historical price and volume data to paint a clearer picture of market behavior, letting you spot trends, reversals, or momentum shifts without guessing. TradingView offers an extensive library of these indicators right out of the box, so even if you’re new to chart analysis, you can start interpreting market signals immediately.
For instance, using these indicators, you can filter out the noise when markets seem choppy or unclear. Instead of staring endlessly at candles hoping to catch a shift, your indicators can highlight when a trend is strengthening or fading. Especially for traders focusing on the Pakistani market or global stocks, these tools can help adapt strategies swiftly according to changing market conditions.
Moving averages smooth out price data to help reveal the underlying direction of an asset. The most commonly used ones—simple moving average (SMA) and exponential moving average (EMA)—track average prices over a set period like 50 or 200 days, providing a quick glance at whether an asset is trending up, down, or sideways. For example, if the 50-day EMA crosses above the 200-day EMA, many traders see that as a bullish sign, suggesting upward momentum.
In TradingView, applying a moving average is straightforward, and you can customize the length based on your trading timeframe. This indicator works best when combined with others, confirming trend strength before entering trades.
MACD is a momentum indicator that shows the relationship between two moving averages. It tracks the difference between the 12-day and 26-day EMAs, plotting a MACD line and a signal line to generate buy or sell cues. When the MACD crosses above the signal line, it’s often interpreted as a buying opportunity; crossing below suggests selling.
This indicator is practical because it captures both trend direction and momentum. Say you’re watching a Pakistani stock like Lucky Cement on TradingView: spotting a MACD crossover can mean catching a strong price move early before many traders jump in.
RSI measures the speed and change of price movements to identify overbought or oversold conditions, ranging from 0 to 100. Typically, readings above 70 hint that the asset might be overbought and due for a pullback, while readings below 30 suggest oversold territory and potential price bounce.
For traders in emerging markets, RSI is valuable because it flags when prices might be stretched beyond reasonable limits. For example, if the Pakistan Stock Exchange index RSI climbs above 70 during a rally, it might be time to tighten stops or prepare for a correction.
Volume oscillator helps track the difference between two moving averages of volume—which can tell you if participation is increasing or decreasing during price movements. Rising volume alongside price gains often confirms a strong trend, while falling volume during price moves may hint at weakness.
Imagine you spot a rising volume oscillator during a rally in Nestle Pakistan shares; this clues you in that buyers are actively pushing the price up, potentially supporting a sustained move.
Bollinger Bands consist of a moving average with an upper and lower band placed at standard deviations away from it. They illustrate price volatility — when bands widen, market swings grow; when they narrow, it signals quieter, tighter trading. Traders use Bollinger Bands to identify overbought or oversold conditions, trend continuations, or potential breakouts.
In practical terms, if a stock like Engro Corporation trades near the upper band consistently, it could indicate strong buying interest but also caution that the price might soon pull back. Conversely, a squeeze (bands coming very close) usually precedes a sharp price move.
Using these built-in indicators well on TradingView can cut down on guesswork and help you recognize market moves before they fully play out. Picking the right indicators for your style and knowing their strengths and limits makes all the difference.
By routinely integrating and interpreting these popular and volume-volatility indicators, you’ll make smarter, more informed trades whether you’re eyeing local stocks in Pakistan or international opportunities.
When it comes to trading, no two strategies are exactly the same, and that's why customizing your TradingView charts is so important. Making the chart match your style doesn’t just make it look nice—it actually helps you spot the signals and trends you care about more quickly and clearly. Every trader, whether you're into scalping or swing trading, can benefit from tweaking charts so they highlight the info most relevant to your approach.
Changing color schemes might sound trivial, but for many traders, it makes a big difference. Picking colors that stand out to you or reduce eye strain means you’re less likely to miss a key price move. TradingView offers plenty of preset themes— from dark backgrounds that reduce glare during late-night sessions to light ones for daytime use. Suppose you trade at night, a dark theme with vibrant candlestick colors helps keep your eyes from getting tired over long hours.
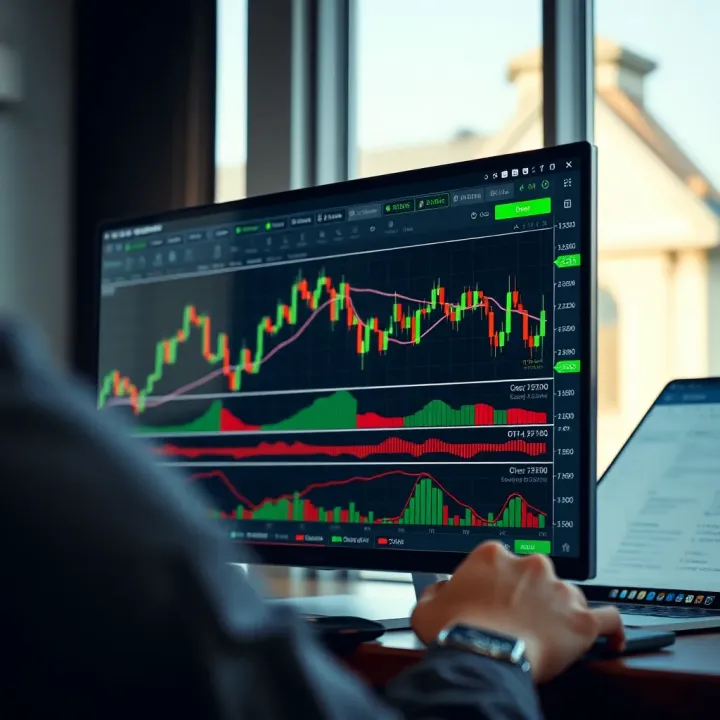
Adding multiple panes is another way to get more insight without switching between screens constantly. For example, you can set one pane to show price movements using candlesticks, another for RSI, and a third for volume. This way you get all critical info stacked vertically, letting you see trend strength and momentum at a glance. It’s super handy if you deal with volatile markets like cryptocurrency or local stocks such as those on the PSX (Pakistan Stock Exchange), where swift decisions can make or break a trade.
Creating templates is a must-have time saver. Instead of rebuilding the same chart layout with your preferred indicators, color scheme, and timeframes every time you log in, save a template that loads instantly. Imagine you're focusing on technical indicators like MACD and Bollinger Bands alongside your price chart. Once you've got the perfect set up, save it as a template called "Tech Combo." Next time, one click pulls up all your settings without fuss.
Loading and editing templates offers flexibility as markets shift. Maybe you tweak your strategy mid-week to be a little more cautious, or want to test a different timeframe quickly. You can load your saved template, adjust features such as indicator parameters or colors, and save it under a new name to track those changes. This adaptability is vital in markets like Pakistan’s KSE-100 index, where economic news can trigger sudden volatility.
Customizing your charts doesn’t just make trading easier—it can improve your decision-making by aligning the tool with how you think and trade.
By making sure your TradingView setup fits your style, you’re not fighting the software—you’re using it to your advantage. This approach saves precious time and keeps your analysis sharp and relevant to the markets you watch most closely.
Visual aids on TradingView charts aren't just pretty decorations; they help traders spot trends and make clearer decisions. Drawing tools let you mark up charts in ways that highlight important price moves and patterns. This section dives into tools that make your chart analysis deeper and more insightful, putting you a step ahead in reading market actions with more confidence.
Trendlines are the bread and butter of technical analysis. They connect price points and reveal the direction and strength of a trend. By drawing a line along rising lows you spot an uptrend, while a line along dropping highs points out a downtrend. This simple tool helps you predict where the price might bounce or break, saving you from acting on false signals.
For example, if you notice a stock like Pakistan's KSE-100 forming higher lows on its daily chart, drawing an ascending trendline gives you a visual cue of a strong bullish wave. Whenever the price nudges near this line, many traders watch closely for buying opportunities.
Geometric shapes, such as rectangles and triangles, help isolate areas where price consolidates or forms breakout patterns. A rectangle might frame a sideways range where price fluctuates between support and resistance, signaling indecision. Triangles often hint at an impending breakout as the price squeezes tighter.
Say you spot a rectangle on a TradingView chart around a key resistance level in a forex pair like USD/PKR. Highlighting this area with a shape can reinforce caution before a breakout or breakdown, helping you avoid jumping the gun.
Adding brief text notes right on charts is a simple but powerful habit. It’s easy to forget why a line or shape was drawn days later. Notes can remind you about a particular setup, news event, or personal observation, keeping your analysis organized.
For instance, you might note "Possible reversal zone" near a support line in the PTCL stock chart before buying. This annotation aids in tracking your thought process and refining strategy over time.
Fibonacci retracement levels are widely used to identify where price might pull back before continuing in its original direction. The key levels—23.6%, 38.2%, 50%, and 61.8%—are plotted between a recent high and low point to uncover potential support or resistance zones.
If you track a sudden bullish run in the Pakistani oil and gas sector stocks, using Fibonacci retracement can help you spot price areas to enter on a dip or set stop losses prudently. It’s far better than guessing where the dip ends.
The pitchfork tool adds depth by drawing three parallel lines based on three selected points, usually following a trend's major highs and lows. It helps in visualizing potential support and resistance within the trend channel more dynamically than simple trendlines.
Besides pitchforks, tools like Gann fans or Elliott Wave overlays are also available, but their effectiveness hinges on understanding their theory — these might fit more advanced traders looking to map market momentum precisely.
Mastering these drawing tools equips you with a personal roadmap on your TradingView charts, breaking down messy market moves into understandable patterns. By combining trendlines, shapes, annotations, and advanced tools like Fibonacci retracement, you're not just watching charts—you're interacting with them, making smarter trading decisions grounded in clearer visual evidence.
Alerts and notifications in TradingView serve as your personal watchdog, keeping an eye on market movements even when you’re away from your screen. For traders, this feature is pure gold—saving you from constantly staring at charts and missing critical price shifts or indicator signals. Whether you trade the Pakistan Stock Exchange or international markets like the NYSE, setting alerts helps you jump in or out at just the right moment without chasing the market blindly.
Creating price alerts takes the hassle out of manual monitoring by notifying you the instant a price crosses a certain level you care about. Imagine you’re watching a key support level on the KSE 100 index at 40,000 points. Instead of refreshing the chart every few minutes, you simply set an alert to ping your phone or email once the price dips below that mark. This ensures you can react quickly to any potential downturn or opportunity.
To set up these alerts, you right-click on the price point on TradingView's chart or use the alert button and specify conditions like crossing up, crossing down, or reaching an exact value. You can also add custom messages to remind yourself why this alert matters, turning vague signals into clear action points.
Alerts based on indicator conditions add a layer of sophistication by signaling when technical data suggests a trading opportunity. For instance, you can create an alert for when the RSI drops below 30 (indicating oversold conditions) or when the MACD line crosses its signal line, hinting at a potential trend reversal. These alerts help traders catch subtle shifts that price alone might miss.
TradingView supports these by letting you select indicators applied on your charts as alert conditions. It's particularly useful for swing traders who rely on momentum or trend changes without sitting glued to their screens all day. You just select the indicator from the alert dialogue box, choose the threshold or condition, and let TradingView do the rest.
Editing and deleting alerts is just as important as creating them. Markets are dynamic; what was a solid entry signal yesterday might become irrelevant tomorrow. TradingView lets you manage your alerts from a central panel where you can pause, change conditions, or remove alerts with a few clicks. This keeps your setup lean and focused on what matters currently.
For example, if you set multiple alerts on oil prices tracking daily fluctuations, but the market shifts trend, you might want to update your alert parameters or delete some to avoid noise. Staying on top of your alerts means you stay in control, not the other way around.
Using alerts to follow multiple assets is a strategy I often recommend for traders juggling different markets or instruments. You could track the US Dollar against the Pakistani rupee, monitor oil prices, and keep an eye on the NIFTY 50 index simultaneously. TradingView allows you to set and receive alerts from all of these within one account without mixing signals up.
By organizing alerts by asset or purpose and using custom nicknames for them, traders prevent confusion and can prioritize actions better. For instance, naming an alert "USD/PKR resistance break" immediately tells you its focus without opening the alert detail.
Effective alert management turns TradingView from just a charting tool into a smart assistant, ensuring you never miss trades while freeing up your time for other analysis or personal commitments.
In short, incorporating alerts and notifications into your trading routine simplifies monitoring, sharpens response times, and helps you capitalize on both price movements and technical indicator signals without constant screen-watching.
Sharing your TradingView charts and analysis isn't just about showcasing your skills; it's a practical step to deepen your understanding, get feedback, and connect with a community of traders. Whether you’re in Karachi or Lahore, the ability to publish and discuss your charts helps build credibility and sharpens your decision-making by inviting fresh perspectives. This section breaks down how you can effectively share your work and collaborate with others, turning your personal insights into collective learning.
When you share snapshots of your charts, you’re essentially freezing a moment in time—capturing your analysis, indicator settings, and drawing tools. This is useful for documenting trade ideas or market setups, especially when you want to track how certain patterns played out or explain your reasoning to others. On TradingView, sharing snapshots is straightforward: just click the camera icon, add a short description, and post. It’s a quick way to get your thoughts out there and invite comments or suggestions. For example, if you spot a bullish divergence on the RSI for PSX stocks, sharing that snapshot lets others see what you see and discuss possible outcomes.
Going a step further than snapshots, writing analysis reports allows you to explain the "why" behind your charts. This might include observations on market conditions, how specific indicators influenced your view, or potential trading strategies. Reports give your charts context, making them more educational and useful for others. For Pakistani traders, this could mean writing about how political events might affect the KSE 100 index and supporting that with chart evidence. Use clear language and back your points with data from your TradingView charts to add weight to your analysis.
TradingView’s social aspect lets you receive and give constructive feedback by commenting on shared charts and reports. This dialogue can highlight blind spots or reinforce your strategy. For example, a fellow trader might point out an important resistance level you missed or confirm your interpretation of a volume spike. Don’t be shy about asking questions – this back-and-forth is how many traders grow. Keep comments respectful and focused to maintain a helpful atmosphere.
Following traders who share insightful content can be a goldmine for learning and staying updated on market trends. It’s like having a circle of mentors and peers who constantly feed you new ideas and perspectives. You might follow local experts focusing on Pakistan's market or international traders who use strategies applicable worldwide. Make it a habit to check their updates regularly and engage where you can; this steady interaction builds your trading IQ and expands your network.
Sharing is not just about broadcasting your ideas; it’s a way to test your theories, get feedback, and tap into collective knowledge. TradingView’s community features are there to help you grow as a trader—not just alone, but with support from others who share your passion.
By actively publishing, commenting, and following, you turn your TradingView experience from a solo endeavor into a dynamic learning process that benefits you and others alike.
TradingView is a powerful tool, but to really get the most out of it in Pakistan, you’ve got to tailor your approach to the local context. Markets here have their own rhythm and character, which means understanding the specifics — from local market hours to available financial instruments — is crucial. This section will cover exactly what traders in Pakistan need to know to harness TradingView’s features without missing a beat.
One of the first things to master is setting TradingView's time zone to Pakistan Standard Time (PKT). Without this, your chart data won’t align with actual market activity, leading to confusion and missed entry or exit points. The Pakistan Stock Exchange (PSX) runs from 9:30 AM to 3:30 PM PKT, Monday through Friday, and being synced to this time frame means your charts reflect real trading hours. For example, if your chart shows candlesticks moving in the middle of the night, you’re likely looking at data that doesn’t match real trades.
To adjust time zones, go to TradingView’s chart settings and select Karachi or PKT. This step helps avoid scenarios like reacting prematurely to price moves that actually happened hours ago in another time zone.
TradingView supports local symbols like KSE100, KSE30, and other Pakistani stocks, allowing you to follow what's actually moving the market here. Instead of tracking foreign stocks alone, incorporate these indices and stocks to get a clear pulse on domestic market trends. For instance, if you’re interested in cements stocks listed here, you can add companies like D.G. Khan Cement or Lucky Cement directly to your watchlist.
Keeping tabs on these local instruments on TradingView not only offers better insight but also helps pinpoint opportunities that international charts might not reveal. Practically, this means you can better time your trades around local earnings reports, policy announcements, or sector-specific news.
Not all brokers in Pakistan integrate smoothly with TradingView, so choosing one that supports its charts can save you headaches. Brokers like IG Markets and Interactive Brokers offer decent integration options but may have certain limitations or fees. For example, some brokers don’t support direct order placement from TradingView charts, meaning you’ll have to switch back and forth between platforms.
Understanding which brokers sync well enables faster trade execution, letting traders act quickly on chart signals. Before signing up, check if your broker offers TradingView compatibility, especially for local equities and forex pairs.
In Pakistan, market data speed and accuracy can be hit or miss due to infrastructure challenges. TradingView’s data for local markets depends on the broker’s feed quality or the exchange’s official feeds they subscribe to. Poor feed quality can lead to delays or incomplete information, skewing your analysis.
For instance, a delayed price update on the PSX may cause you to enter a trade late, missing the ideal entry point. To deal with this, validate the data feed quality before relying heavily on TradingView charts for real-time decisions. Some traders opt to cross-check with broker platforms or official exchange websites.
Always verify your data sources and broker compatibility to avoid nasty surprises when every second counts in trading.
By keeping these tips in mind — syncing your charts to PKT, focusing on local instruments, choosing the right broker, and confirming data feed reliability — you’ll fine-tune your TradingView use for better, faster decisions in Pakistan’s unique trading environment.
📈 Learn how to seamlessly integrate TradingView charts and tools with Deriv, overcoming challenges and boosting your trading strategies effectively.
📈 Discover how Pakistani traders can combine TradingView with Deriv for smarter trading. Learn integration steps, tips, and strategies to boost your trades!
📈 Discover how traders in Pakistan can combine TradingView charts with Deriv platform to enhance strategies with practical tips and powerful tools.

📈 Explore how combining TradingView charts with Binary.com boosts your binary options trading. Learn setup, strategies, and automation tips for smarter trades!
Based on 13 reviews