
How to Use TradingView with Deriv
📈 Learn how to seamlessly integrate TradingView charts and tools with Deriv, overcoming challenges and boosting your trading strategies effectively.
Edited By
Sophie Morgan
Trading in today’s markets calls for sharp tools and clear insights. That’s where TradingView combined with Deriv.com steps in, offering a dynamic duo for traders. Whether you're scalping forex or eyeing commodities, the integration allows you to track charts, apply indicators, and execute trades without jumping between platforms.
For traders based in Pakistan, this synergy simplifies navigating volatile markets with localized needs in mind. The article unpacks setup details, key features, and practical analysis techniques featuring real-life trading scenarios you won’t find in your average guide.

Harnessing data effectively can mean the difference between just watching the market and actively profiting from it.
We’ll cover everything from getting started to advanced charting tips tailored to the Deriv platform, making trading less of a guessing game and more a well-informed strategy session. Expect detailed guidance that matches the pace of Pakistani markets and the trading styles common here.
By the end, you’ll understand how to leverage TradingView’s charts and tools directly on Deriv.com for smarter, quicker decisions that align with your investment goals. No more toggling between tabs or hunting down scattered resources – it’s all explained step-by-step, helping you trade with confidence and clarity.
When you're setting out to trade smarter, getting familiar with your tools is step one. This section lays the groundwork by exploring what TradingView and Deriv.com bring to the table, especially from the perspective of traders based in Pakistan. Both platforms have carved unique spaces in the trading world, and understanding their strengths helps you make better trading decisions.
TradingView is a go-to charting platform that's widely used across the globe. Its user-friendly interface coupled with powerful tools makes technical analysis practical even for beginners. On the other hand, Deriv.com offers a trading environment where you can apply those insights directly, spanning various markets with an efficient platform tailored to both new and seasoned traders. Knowing how these two connect can streamline your workflow and boost your trading edge.
TradingView is basically the Swiss army knife for chart lovers. It serves up a wide variety of interactive charts, updated in real-time, for assets ranging from forex to cryptocurrencies. For instance, a Pakistani trader could use TradingView to track the US Dollar to Pakistani Rupee pair, monitoring its movement vividly throughout the day.
Since charts are the backbone of technical analysis, TradingView’s ease of access to candle patterns, trend lines, and volume bars makes spotting market trends more straightforward. It’s the kind of platform that doesn’t bog you down with fuss but gives you exactly the tools you need.
TradingView isn’t just about charts; it also offers an extensive library of technical indicators like RSI, Bollinger Bands, and MACD, all customizable to suit your style. Add to that the social aspect—millions of users share trading ideas, scripts, and strategies—which turns the platform into a lively marketplace of thoughts.
What sets TradingView apart is its cloud-based nature, so no matter where you log in from—whether Karachi, Lahore, or abroad—your setups stay intact. This reliability and community-driven environment make it a favorite among traders worldwide, including the growing clientele in Pakistan.
Deriv.com is designed with simplicity and variety in mind. It supports multiple account types and offers a suite of trading instruments that range from digital options to forex and CFDs. What’s neat about Deriv.com is how it balances accessibility with advanced features, like custom contracts and automated trading options.
The user interface is clean, making it less intimidating for beginners but still packed with enough power for professionals. For example, you can trade digital options with expiry times as short as 10 seconds, giving you fast feedback if you’re testing a hunch.
Deriv.com gives you access to an impressive set of markets: forex pairs (including USD/PKR), commodities like gold and oil, indices, and cryptocurrencies such as Bitcoin and Ethereum. This variety means traders in Pakistan can diversify their portfolios and switch between markets depending on economic news or price movements.
Moreover, Deriv.com often rolls out new assets, keeping up with market demand. This flexibility suits traders who want both conventional options and exposure to newer markets like crypto.
Bringing TradingView into the Deriv.com experience means the best of both worlds: professional-grade charting tools paired directly with execution capabilities. This integration streamlines your trading process—no more juggling tabs or copying prices manually.
For example, while monitoring a price breakout on a TradingView chart, you can immediately make a trade on Deriv.com without fuss. This immediacy can be the difference between catching a profitable move or missing out.
Accessing TradingView charts directly within the Deriv.com platform is straightforward. After logging into your Deriv.com account, you can pull up TradingView's interactive charts bundled within the same interface. Customizable tools and indicators are right at your fingertips, ensuring your technical analysis is up to date.
This blend is especially helpful in volatile markets where seconds matter. Pakistani traders, for instance, can quickly sense an uptrend in USD/PKR and decide to take positions, all without switching devices or applications.
Integrating TradingView with Deriv.com doesn’t just save time—it helps traders respond faster and more accurately, turning analysis into action smoothly.
In the following sections, we’ll break down how to set up this integration and get the most out of the combined platform features.
Setting up TradingView on Deriv.com is a critical step for anyone serious about trading with a modern edge. Without a proper setup, you might miss out on the smooth experience and powerful tools that this integration offers. Think of it like gearing up before a trek; a good setup ensures you’re well-prepared and ready to navigate the markets confidently.
By understanding each element of the setup process, traders can maximize efficiency and reduce the chances of missing crucial trade opportunities. For instance, logging in seamlessly and customizing your layout means you save time and stay sharp, reacting quickly to market moves. This section highlights how to create, link, and navigate the interface so you hit the ground running.
To get started, you first need to create an account on Deriv.com. The process is straightforward but requires attention to detail to avoid hiccups later. Start by visiting Deriv.com’s registration page and enter your basic personal info—name, email, and password. Pakistani traders should ensure their details match official documents because verification is essential for both withdrawal and deposit processes.
After submitting the registration form, an email verification step follows. Confirm your email by clicking the link sent to your inbox. This step keeps your account secure and is standard practice for trustworthy trading platforms.
Lastly, log in and complete the Know Your Customer (KYC) process. This might feel like a chore, but it’s necessary for compliance with financial regulations. You’ll need to upload identification and proof of address. Once verified, you’re clear to deposit funds and start exploring the markets.
Once your Deriv.com account is up and running, the next step is linking it to TradingView. This connection allows real-time data feeds and lets you use TradingView’s advanced charting tools directly through Deriv.com, without juggling between platforms.
To link the accounts, log into Deriv.com and look for the TradingView integration option, usually found in the trading tools or account settings menu. You’ll be prompted to log into your TradingView account or create one if you haven’t yet.
Once connected, you can start opening TradingView charts inside Deriv.com instantly. This streamlines your workflow since you won't need to manually input trade details or switch tabs. The result is a fluid experience where analysis and trading happen side by side in one window.
Inside Deriv.com, TradingView’s interface feels familiar yet tailored to blend with the platform’s environment. The chart takes center stage, displaying everything from candlesticks to line charts, depending on your choice.
On the left sidebar, you’ll find essential drawing tools like trend lines, Fibonacci retracements, and text annotations. These help map out market movements and spot potential trade signals. The top bar offers quick access to timeframes, indicators, and chart settings, keeping frequently used options close at hand.
For traders in Pakistan, this setup is handy because it reduces clutter and lets you focus solely on analysis and trade execution without distraction.
TradingView on Deriv.com lets you personalize your workspace to suit how you trade. Customizing the layout means you can save chart templates with your preferred indicators and color schemes. For example, some traders prefer a dark background with bright candlesticks for clear visibility during long sessions.
You can also set up multiple chart windows side by side to monitor different assets or time frames simultaneously. This is particularly useful for those trading forex pairs alongside synthetic indices available on Deriv.com.
Remember, a clutter-free, tailored workspace helps you spot opportunities faster and react without hesitation—turning what could be a confusing screen into a well-organized trading hub.
Pro tip: Spend some time tweaking your charts and saving templates before diving into live markets. It makes all the difference in keeping your mind clear and your moves sharp.
By carefully setting up and customizing TradingView on Deriv.com, traders ensure they’re not just jumping in blind but are equipped with a powerful toolkit designed to support their trading goals effectively.
TradingView’s integration with Deriv.com offers traders a robust set of features that bring real clarity to decision-making. Rather than just staring at static charts, traders gain tools to analyze, respond quickly, and stay ahead of market movements. This section cuts right to the heart of those features, so you can leverage them like a pro.
The whole point here is to make trading smoother and smarter. Whether it’s spotting a trend early, setting meaningful alerts, or customizing your charts to fit your style, these tools help you avoid guesswork and get straight to actionable insights. For example, spotting a candlestick reversal pattern on a currency pair and immediately setting an alert to catch a breakout can make all the difference for your trade.
TradingView offers various chart types across Deriv.com to suit different trading styles and strategies. The main types are candlestick, line, and bar charts, each painting a unique picture of market data.
Candlestick charts show open, high, low, and close prices in a way that's easy to digest. Traders often prefer this because individual candlesticks form recognizable patterns that hint at future price moves. If you’re watching the USD/PKR pair, for example, a hammer or shooting star pattern on a candlestick chart could signal a reversal worth watching.
Line charts connect closing prices with a simple line, stripping away noise and focusing on the overall trend. This is handy if you want a quick, clean view without the distractions of intraday volatility. It’s perfect for long-term investors or those just starting out who want to understand the price direction without extra clutter.
Bar charts resemble candlesticks but display price range slightly differently. Each bar shows the high, low, and close, giving a detailed price action snapshot. Day traders or scalpers often use bar charts to gauge intraday momentum and volatility.
Choosing the right chart type depends on your trading style and what kind of info you want to see:
Go with candlesticks if you’re actively trading and need to identify patterns or reversals.
Choose line charts for a broad look at the market’s direction without all the minor price flickers.
Use bar charts when you want granular detail on price range and are focused on shorter-term trades.
Being flexible with these charts — switching between them as market conditions change — often gives more insight than sticking rigidly to one.
Technical indicators on TradingView are like your trading GPS. On Deriv.com, you have access to popular ones like the Relative Strength Index (RSI), Moving Average Convergence Divergence (MACD), Bollinger Bands, and Simple or Exponential Moving Averages (SMA/EMA).
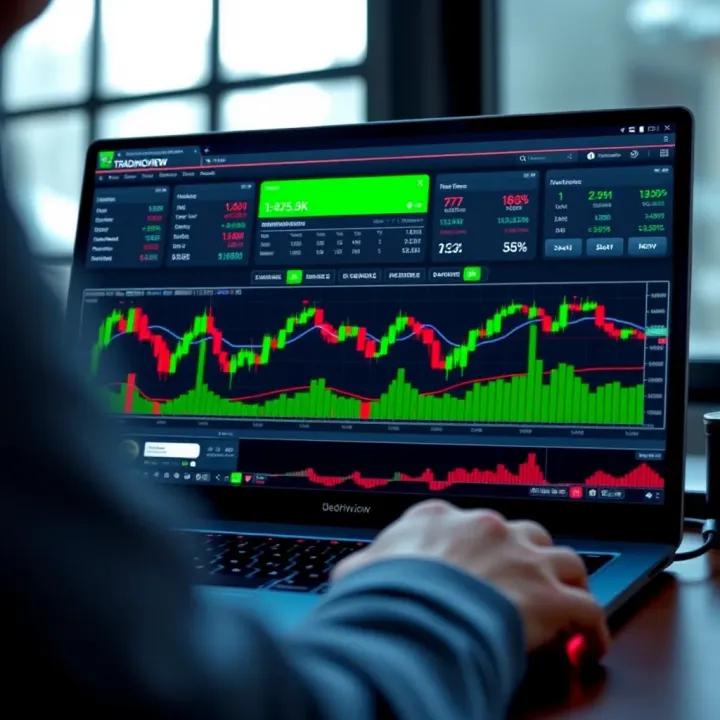
For instance, the RSI helps gauge if an asset is overbought or oversold, potentially signaling when a correction is around the corner. Pairing RSI with MACD can give confirmation, reducing false signals. Say you spot an RSI below 30 on crude oil prices while MACD also shows bullish crossover — that’s a solid cue to consider a buy.
Drawing tools are just as important. Trend lines, Fibonacci retracements, and support/resistance levels let you sketch out where prices might bounce or break out. Imagine you’re charting the Pakistan Stock Exchange’s KSE 100 chart: drawing support lines around historical lows helps predict if a dip will hold or worsen.
To use them effectively:
Start by marking obvious highs and lows.
Use trend lines to highlight ongoing market directions.
Apply Fibonacci retracements during corrections to spot entry points.
Practice makes perfect here, because these drawings often guide your stop-loss settings and profit targets.
Waiting around for the right moment to act can cost money. That’s why TradingView’s real-time data and alert features on Deriv.com are essential.
Setting price alerts means you don’t have to watch the screen all day. For example, if you want to enter a trade when GBP/USD hits 1.4000, you can set an alert to ping you on your phone or email. This alert system frees you up and still keeps you connected to critical market moves.
Watching live market movements with real-time data means your charts update instantly as trades happen. This immediacy is crucial, especially when trading volatile assets like cryptocurrencies or forex pairs. For Pakistani traders, who might juggle market hours or internet disruptions, having up-to-the-second visuals ensures you react in time.
“A good alert system paired with real-time data lets you catch opportunities that otherwise slip by unnoticed.”
To sum up, mastering these key trading features on TradingView through Deriv.com means you can tailor your trading experience to your needs, react faster, and make smarter choices. Use the chart types that fit your style, rely on proven indicators and drawing tools to guide your trades, and stay connected with alerts and real-time updates. That’s how you move from guessing to knowing in your trading game.
Using TradingView on Deriv.com for technical analysis can really sharpen your edge in trading. It’s not just about looking at charts; it’s about interpreting price movements with real tools that help to spot trends, patterns, and volume changes. This section zeroes in on how traders can use these features practically to make smarter decisions rather than guessing in the dark.
Support and resistance levels are like the floors and ceilings of a price chart—they show where price tends to stop and reverse. On TradingView, spotting these lines helps you decide where to enter or exit trades. For instance, if a stock keeps bouncing off a price point of 150 PKR, that’s your support. If it frequently hits 170 PKR but can’t break through, that’s resistance.
Why is this useful? Knowing these helps avoid buying at a high where price might reverse or selling too early. On Deriv.com, you can quickly draw horizontal lines on your chart to mark these levels, helping you visualize crucial zones without guessing.
Moving averages smooth out price action to reveal the underlying trend over time. A 50-day moving average, for example, averages the past 50 days’ prices to show if a stock or asset is trending up or down. When price crosses above a moving average, it often signals an uptrend; crossing below hints at a downtrend.
Traders on Deriv.com can add simple moving averages (SMA) or exponential moving averages (EMA) from TradingView tools. Use these averages as dynamic support or resistance and gauge momentum. For example, when the 20-day EMA crosses over the 50-day SMA, that signals potential buying opportunity.
Recognizing chart patterns like head and shoulders, double tops/bottoms, and flags is key to predicting possible price moves. These patterns, visible on TradingView charts, are built from the price highs and lows forming recognizable shapes.
For example, a "double bottom" looks like a W shape and often means the downtrend might be ending, signaling a possible price rise. Spotting these on Deriv.com allows traders to anticipate and plan trades before big moves.
Once a pattern forms, what next? TradingView lets you set entry points, stop losses, and profit targets based on patterns. For instance, after confirming a head and shoulders pattern has completed, you might place a sell order just below the neckline to catch the expected drop.
The key is patience and confirmation—don't rush in just because a pattern looks neat. Wait for volume confirmation or a breakout to validate your trade.
Volume shows the number of shares or contracts traded during a timeframe. It reveals how strong a price move really is. A price rise with low volume can be shaky; high volume confirmation suggests it’s more reliable.
Say a currency pair on Deriv.com spikes in price with doubling volume—this hints at strong buying interest and could be more than a quick blip.
TradingView integrates volume tools such as the On-Balance Volume (OBV) and Volume Moving Average. OBV adds volume on up days and subtracts it on down days, helping identify accumulation or distribution pressures.
On Deriv.com, using these indicators helps traders see whether large players are entering or exiting the market. This can guide decisions like holding a position longer or locking in profits.
Successful technical analysis is about combining these elements: trends, patterns, and volume tell a fuller story that guides trading choices with clearer signals.
Use these tools on TradingView in your Deriv.com account to not just watch the market—understand it deeply. This makes your trades smarter and reduces guesswork, vital for anyone serious about trading in today's fast-paced markets.
Understanding how fundamental analysis complements technical tools is essential for any trader focused on long-term success, especially when using TradingView on Deriv.com. This section breaks down how fundamental data, like financial news and economic indicators, fit into your trading strategy and affect market movements. It’s not just about watching charts; it’s about grasping the ‘why’ behind price changes, which can give traders a solid edge.
Knowing where and how to get timely financial news is a game changer. TradingView and Deriv.com offer integrated sources where you can monitor real-time market developments. For example, if you spot news about a surprising interest rate cut from the State Bank of Pakistan, you can anticipate potential impacts on currency pairs like USD/PKR. Keeping an eye on such updates helps traders adjust on the fly rather than chasing the market after big moves have already happened.
Economic calendars on TradingView present scheduled events like GDP releases, inflation reports, or trade balances, key for predicting market reactions. For instance, the monthly inflation report in Pakistan can trigger noticeable volatility in commodities or forex pairs on Deriv.com. Traders should mark these calendar dates in advance and plan trades around them to either capitalize on the volatility or avoid unexpected losses.
Charts on TradingView reflect how markets digest news. A corporate scandal or government policy announcement might cause sudden price swings visible on candlestick charts. Imagine a sudden drop in shares of a Pakistani textile company after a bad earnings call; spotting this kind of price movement quickly helps traders decide if they want to cut losses or jump in for a potential rebound.
Earnings reports provide concrete data on company performance that affects stock prices directly. When a firm listed on the Karachi Stock Exchange releases stronger-than-expected earnings, you might see an uptick on TradingView charts accessed via Deriv.com. By cross-referencing the earnings details with historical price trends, traders can verify if the market’s reaction is justified or if it presents an arbitrage opportunity.
Fundamental analysis is not just headline chasing; it’s about connecting those headlines to actual price behavior. TradingView on Deriv.com puts both data and visualization tools at your fingertips, blending quantitative and qualitative insights to help make smarter trade decisions.
Using these tools effectively means you’re not only reacting to the market but anticipating changes before they fully unfold. That’s how you keep your trading edge sharp while navigating Pakistan’s markets.
Trading smart means having a strategy, plain and simple. Using TradingView on Deriv.com gives traders a solid toolkit, but without a plan, all those charts and indicators can turn into noise. Strategies help bring structure and discipline, ensuring every move you make isn’t just a shot in the dark. When you build effective trading strategies tailored to these platforms, it means you’re better positioned to manage risk, spot good opportunities, and stay disciplined even when markets get wild.
For example, imagine a trader who just jumps on every trend they see on TradingView—without a plan, they might get burned by sudden reversals. But someone with a clear strategy, including defined entry/exit points and risk limits, can navigate those ups and downs more confidently. This section focuses on how you can craft such strategies step-by-step.
Before clicking buy or sell, it's crucial to get your goals straight. Are you looking for short-term trades, or playing the long game? Do you want to grow your account steadily, or are you aiming for those big wins? Setting clear goals helps you avoid emotional decisions and keeps you on track.
Next up are risk parameters—this simply means deciding how much you're willing to lose on any given trade. Say your account has $1,000, and you decide not to risk more than 2% per trade. That limits your loss to $20 per trade, protecting your account from big hits. This approach stops common mistakes like chasing losses or over-leveraging.
Key points for goal-setting and risk management:
Define realistic profit targets and loss limits
Use risk-to-reward ratios (aiming for at least 1:2) to evaluate trades
Stick to your plan, even when the market teases you
This structure ensures you’re not gambling blind but trading with your head on.
Not every market suits every trader. Deriv.com offers a range of instruments—from forex pairs and commodities to indices and synthetic indices. Picking the right ones depends on your style, availability of data on TradingView, and how volatile you want your trades to be.
If you’re starting out or prefer steadier moves, currency pairs like EUR/USD are a good pick because they’re highly liquid and have stable spreads. On the other hand, commodities like gold or oil can bring bigger swings but also larger opportunities.
Consider these factors when selecting instruments:
Volatility: More volatility means bigger swings, both gains and losses
Liquidity: High liquidity ensures smoother order execution
Correlations: Knowing which instruments move together or against each other helps diversify risk
Choosing wisely saves you from chasing markets that just don’t fit your risk profile or schedule.
Stop losses are your safety net. No matter how confident you are in a trade, the market can flip unexpectedly. Setting a stop loss means you decide in advance the price at which you’ll cut your losses and exit automatically.
For example, if you buy USD/JPY at 110.00, you might set a stop at 109.50. If the price starts slipping, your trade closes before you lose more than you planned. This technique is especially handy when you can’t stare at the screen all day.
Remember:
Always use stop losses to protect capital
Place stops based on technical levels, like just below support
Avoid moving stop losses further away in hope—the market doesn’t owe you
Using stop losses helps keep emotions out and prevents messy losses.
Knowing how much to invest per trade is just as important as picking a strategy. Position sizing means deciding the number of units, contracts, or lots you’ll buy or sell based on your risk limit.
Say your risk per trade is $20, and your stop loss is 50 pips away. You divide $20 by 50 pips to get your pip value or position size. This keeps your potential loss consistent across trades regardless of the instrument.
Tips for smart position sizing:
Use fixed percentage risk per trade (like 1-2% of account)
Adjust size based on volatility; wider stops call for smaller positions
Recalculate size after big wins or losses to protect your gains
Position sizing paired with stop losses keeps your wins and losses balanced over time.
Why jump right in with real money when you can test your ideas risk-free? Backtesting means running your trading strategy against historical data on TradingView charts. This way, you can see how it might have performed without guessing.
For example, if you’ve developed a moving average crossover system, backtesting shows how many times it would have triggered profitable trades or false signals in past months. You can tweak your rules to improve results before risking a dime.
Backtesting is crucial because it:
Gives confidence in your strategy’s logic
Helps you avoid costly mistakes early
Allows you to refine tactics based on past patterns
Paper trading is taking backtesting a step further by simulating live trading. On Deriv.com, you can place trades with virtual funds, experiencing real-time market conditions without financial risk.
This practice is golden for:
Getting comfortable with the platform’s order entry and management
Understanding how your strategy behaves in live markets
Building discipline by following your plan strictly
Many traders find paper trading bridges the gap between theory and reality, saving them from costly rookie errors.
Trading is as much about managing yourself as managing markets. Using TradingView with Deriv.com is powerful, but only when paired with clear strategies, sound risk management, and practice through backtesting and paper trading can you truly step up your game.
Start small, plan well, and learn constantly—that’s the real edge.
Navigating the online trading scene from Pakistan comes with its own unique set of challenges and opportunities. It's not just about picking the right stocks or mastering the TradingView tools on Deriv.com; understanding local market conditions, regulations, and practical hurdles can make a huge difference. This section zeroes in on those specifics, helping Pakistani traders avoid common pitfalls while optimizing their trading strategies. Whether it’s about legal restrictions, timing trades effectively for local hours, or leaning on community support, these tips offer solid ground.
Pakistan has a strict regulatory environment for financial trading. The Securities and Exchange Commission of Pakistan (SECP) keeps a close eye on brokers and platforms available to residents. This means traders have to be cautious about choosing brokers that offer legal and vetted access. Deriv.com is accessible to Pakistani users, but understanding whether your chosen trading platform complies with local laws can save you a lot of headaches, including sudden account freezes or withdrawal issues.
For example, if you try to use an unregistered forex broker, it might result in delays or even loss of funds due to non-compliance. Always double-check if the platform has proper licensing or at least transparent policies and a good reputation.
Sometimes, platforms or markets might be restricted or limited based on geographical location. While some traders turn to VPNs to bypass these blocks, this can be a double-edged sword. Using a VPN can allow access to certain features or markets otherwise unavailable in Pakistan but might violate the platform’s terms of service. It’s essential to weigh the risks.
When it comes to payments, options like JazzCash, Easypaisa, or international cards are popular. Deriv.com supports a variety of payment methods, but Pakistani traders often find themselves juggling different gateways due to local banking restrictions. Using reliable e-wallet services or understanding currency conversion fees can ensure smoother deposits and withdrawals.
Pakistan Standard Time (PST) is generally 5 hours ahead of GMT, which means the best trading hours for certain markets might fall awkwardly into early mornings or late evenings for local traders. For instance, the London Stock Exchange opens at 3:30 PM PST, making late afternoon an ideal time for those focusing on European markets.
Traders dealing with forex pairs involving USD should tune into when the New York session opens (around 9:30 PM PST). Being awake and alert during these high volatility hours can provide better opportunities to capitalize on price moves.
Sometimes, two major markets overlap in their open hours, causing unpredictable price swings due to increased volume. While this is great for experienced traders, beginners from Pakistan might find it overwhelming. For example, the overlap between London and New York sessions starts around 8:30 PM PST and runs until 11:30 PM PST, traditionally the most volatile period.
Avoiding or carefully approaching trades in this window can reduce unnecessary risk unless you’ve specifically strategized for volatile markets. Adjusting trading plans based on time zone overlaps can help avoid stress and better manage risk.
Pakistan has a growing community of traders who meet online and in person to share tips, screen readings, and strategy feedback. Joining Telegram groups, Facebook pages, or attending local meetups in cities like Karachi or Lahore can provide invaluable insights—particularly around practical issues like navigating Deriv.com’s features or country-specific payment solutions.
Being part of such communities helps in staying updated on market trends and avoiding common rookie mistakes, like misinterpreting TradingView signals or missing regulatory notices.
Thankfully, the availability of localized educational content is improving. From YouTube channels run by Pakistani financial educators to blogs and webinars focusing on tools like TradingView, there’s plenty to learn. Resources tailored to the Pakistan market often take into account local tax regulations, currency concerns, and broker selection—something international tutorials might miss.
A good starting point is to look for material emphasizing practical application on Deriv.com combined with TradingView charts, helping new traders get hands-on experience with realistic examples.
For Pakistani traders, knowing the local quirks is just as important as mastering the technical indicators. From regulations to community support, these grounded tips help make TradingView on Deriv.com not just a tool, but a trusted trading companion.
Navigating TradingView on Deriv.com without hiccups is key for traders aiming for smooth operations and timely decisions. Technical support and troubleshooting form the backbone of this seamless experience. When you encounter snags, immediate solutions prevent any loss of momentum which, in fast-moving markets, can mean the difference between profit and loss. Practical support means you're not left scratching your head over login glitches or frozen charts, allowing you to keep your eyes on the prize.
One of the most common headaches traders face is trouble logging in or maintaining a stable connection. For example, a Pakistani trader might find their session abruptly cut off due to internet instability or regional restrictions. This disrupts real-time market monitoring and can result in missed trades. To counter this, always ensure your internet connection is stable before logging in. Clearing browser cache or switching browsers can sometimes do the trick. If persistent, checking if your IP is blocked or using a reliable VPN can help bypass local connectivity issues.
When TradingView charts fail to load properly on Deriv.com, it can stall your technical analysis. This often happens due to sluggish internet or browser extensions conflicting with chart scripts. A quick fix is to disable unnecessary browser plugins or update your browser to the latest version. Also, refreshing the page or logging out and back in can reset the session. These errors often highlight the importance of using a robust browser and having a reasonable internet speed, especially in regions with fluctuating connectivity.
If the issues persist beyond quick troubleshooting, Deriv.com's customer service is your next best stop. Their support team is trained to handle platform-specific problems, like transaction hiccups or account verification delays. Pakistani traders should note that contacting support during their market hours often leads to faster responses. Keep handy your account details and a clear description of the problem to speed up resolution.
For issues directly related to the TradingView interface or charting tools, TradingView's own support is invaluable. Their help center covers a wide array of topics, from technical indicator glitches to account management. Since TradingView is widely used globally, their support resources are well-documented and updated regularly. Engaging with their community forums can also provide practical advice from other traders who might have faced similar issues.
Quick tip: Always document any error messages or unusual behavior. This info is gold when you contact support teams, helping them diagnose and fix problems faster.
By understanding common problems and knowing where to turn for help, Pakistani traders can ensure their TradingView experience on Deriv.com remains as uninterrupted as possible. Troubleshooting isn’t just a chore — it’s part of trading smarter, keeping your strategies on track even when technology tries to throw a wrench in the works.
📈 Learn how to seamlessly integrate TradingView charts and tools with Deriv, overcoming challenges and boosting your trading strategies effectively.
📈 Discover how Pakistani traders can combine TradingView with Deriv for smarter trading. Learn integration steps, tips, and strategies to boost your trades!
📈 Discover how traders in Pakistan can combine TradingView charts with Deriv platform to enhance strategies with practical tips and powerful tools.
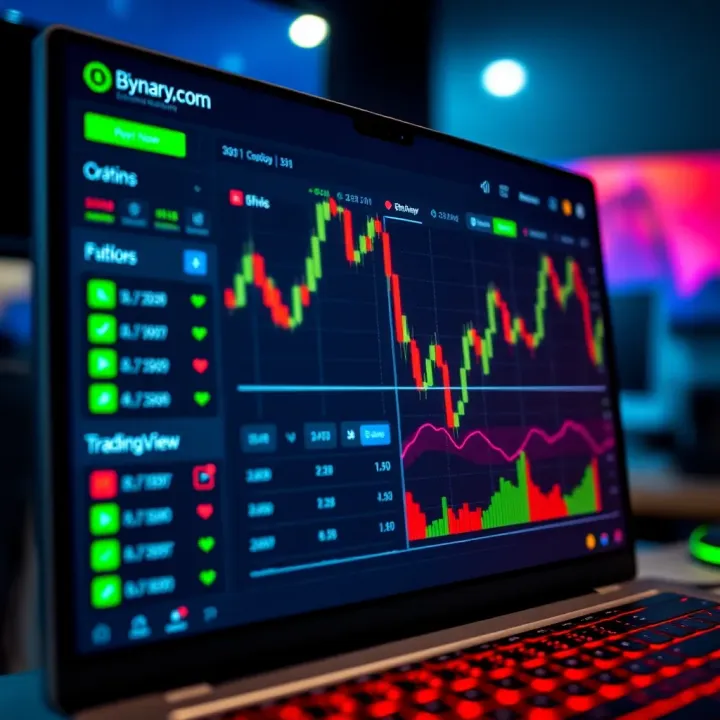
Discover how to connect TradingView 📈 with Binary.com for smarter binary options trading in Pakistan 🇵🇰. Get practical tips and boost your strategy today!
Based on 7 reviews